How Much Buyer Leverage Does Each North Texas County Have Right Now? A County-by-County Look

It depends on the county. In September 2026, Grayson County had about 9.5 months of housing supply, a buyer-leaning level, while Collin and Denton counties each had about 5.5 months, close to balanced. Homes in Grayson County also sold for a smaller share of list price than in any other county reviewed.
This article compares Collin, Denton, Grayson, Dallas, Rockwall, Kaufman and Hunt counties using North Texas Real Estate Information Systems (NTREIS) data on residential sales through September 2026, retrieved by Rise Realty Texas on October 7 and October 10, 2026. Residential sales include site-built, mobile and manufactured homes and exclude leases, commercial properties and raw land. The data covers homes listed in the MLS, which leaves out most new construction that builders sell directly. Data is current as of October 10, 2026.
What does months of supply mean, and what counts as a balanced market?
Months of supply is the number of months it would take to sell every active listing at the current pace of sales. Rise Realty Texas calculates it by dividing a month’s active listings by that month’s closed sales. The Texas Real Estate Research Center at Texas A&M University has described six to 6.5 months of inventory as a balanced market. Lower supply generally favors sellers, and higher supply generally favors buyers.
Supply shifts with the seasons, so this article compares each September with the previous September. NTREIS publishes months of inventory only as whole numbers, so the figures here carry decimals. Because late-reported closings can still change September’s sales counts, figures for the four smaller counties are rounded to the nearest half month.
How do North Texas counties compare in September 2026?
The seven counties fall into two groups: Dallas, Collin and Denton at 5.2 to 5.5 months of supply, and Rockwall, Kaufman, Hunt and Grayson at about 7 to 9.5. The six to 6.5 months that Texas A&M describes as balanced falls between the two groups. Homes in Dallas County sold fastest, at a median of 29 days. Homes in Rockwall County took the longest, at 67 days. Every county took longer to sell a home than it did in September 2023.
| County | Months of supply, Sept. 2026 | Months of supply, Sept. 2025 | Median days to sell, Sept. 2026 | Sold price as share of list price, Sept. 2026 | Closed sales, July–Sept. 2026 vs. a year earlier |
|---|---|---|---|---|---|
| Dallas | 5.2 | 5.0 | 29 | 98.2% | −4.8% |
| Collin | 5.5 | 4.8 | 46 | 97.8% | −7.8% |
| Denton | 5.5 | 4.8 | 46 | 98.0% | −2.1% |
| Rockwall | 7.0 | 6.0 | 67 | 97.9% | −5.0% |
| Kaufman | 7.5 | 6.0 | 48 | 99.0% | −20.7% |
| Hunt | 8.0 | 9.5 | 50 | 97.9% | −4.6% |
| Grayson | 9.5 | 7.5 | 60 | 97.3% | −7.1% |
Months of supply is active listings divided by closed sales in the month, rounded to the nearest half month for Rockwall, Kaufman, Hunt and Grayson. Median days to sell and the sold-price-to-list-price share are NTREIS measures. Hunt County figures rest on about 130 sales a month and move more than figures for larger counties.
What is happening in Collin County?
Collin County moved toward balance because fewer homes sold, not because more homes were listed. Months of supply rose from 2.9 in September 2023 to 4.0 in 2024, 4.8 in 2025 and 5.5 in 2026. Active listings in September were 6,744, less than half a percent below the 6,768 of a year earlier. They ran 13 percent above the prior year in January and have stayed within roughly 1 percent of it since June. New listings fell 7.5 percent. Closed sales fell 13.5 percent, from 1,424 to 1,232.
Homes took a median of 46 days to sell, one day fewer than a year earlier and more than double the 21 days of September 2023. They sold for 97.8 percent of list price. The median closed price was $439,950, down 1.8 percent from $448,000. A median reflects which homes sold in a given month and is not an appraisal of value.
What is happening in Denton County?
Denton County looks much like Collin County, with a bit more inventory and a smaller drop in sales. Months of supply reached 5.5 in September, up from 4.8 a year earlier, 4.1 in 2024 and 2.7 in 2023. Active listings rose 3.3 percent to 5,826. New listings dipped 1.5 percent, and closed sales fell 9.0 percent to 1,059.
Homes took a median of 46 days to sell, up from 44 a year earlier and 26 in September 2023, and sold for 98.0 percent of list price. The median closed price was $420,000, down 4.1 percent from $437,750. Denton County’s closed sales for July through September fell 2.1 percent, the smallest drop of the seven counties.

Why does Grayson County look so different?
Grayson County has the most months of supply of the seven counties and the lowest share of list price received at closing. Months of supply reached about 9.5 in September 2026, up from about 7.5 a year earlier, 6.5 in 2024 and 5 in 2023. Active listings were 1,681, up 7.8 percent from a year earlier. In June 2026 listings were 1 percent below the prior year, and by September they were 8 percent above it. Closed sales fell 15.4 percent, from 208 to 176.
Homes took a median of 60 days to sell, up from 55 a year earlier and 41 in September 2023. They sold for 97.3 percent of list price, down from 98.0 percent. On a hypothetical $300,000 listing, 97.3 percent is about $291,900, while the 99.0 percent seen in Kaufman County would be $297,000. The example illustrates the gap and is not a prediction for any one home.

What about Dallas, Rockwall, Kaufman and Hunt counties?
Dallas County is the tightest of the seven, and the outer counties show more buyer leverage with mixed signals. Dallas County had 5.2 months of supply, and its median days to sell fell from 34 to 29 even as September closed sales dropped 7.4 percent. Rockwall County reached about 7 months, and its homes took a median of 67 days to sell, the longest of the seven.
Kaufman County reached about 7.5 months of supply, up from about 6, because closed sales fell 20.2 percent in September and 20.7 percent over the third quarter, the steepest drop of the seven. Yet Kaufman homes sold for 99.0 percent of list price, the highest of the seven, and sold faster than a year earlier, at 48 days versus 60. Hunt County is the one county where supply eased, from about 9.5 months to about 8, as active listings fell 6.4 percent and September sales rose from 116 to 127.
Do these numbers include new construction?
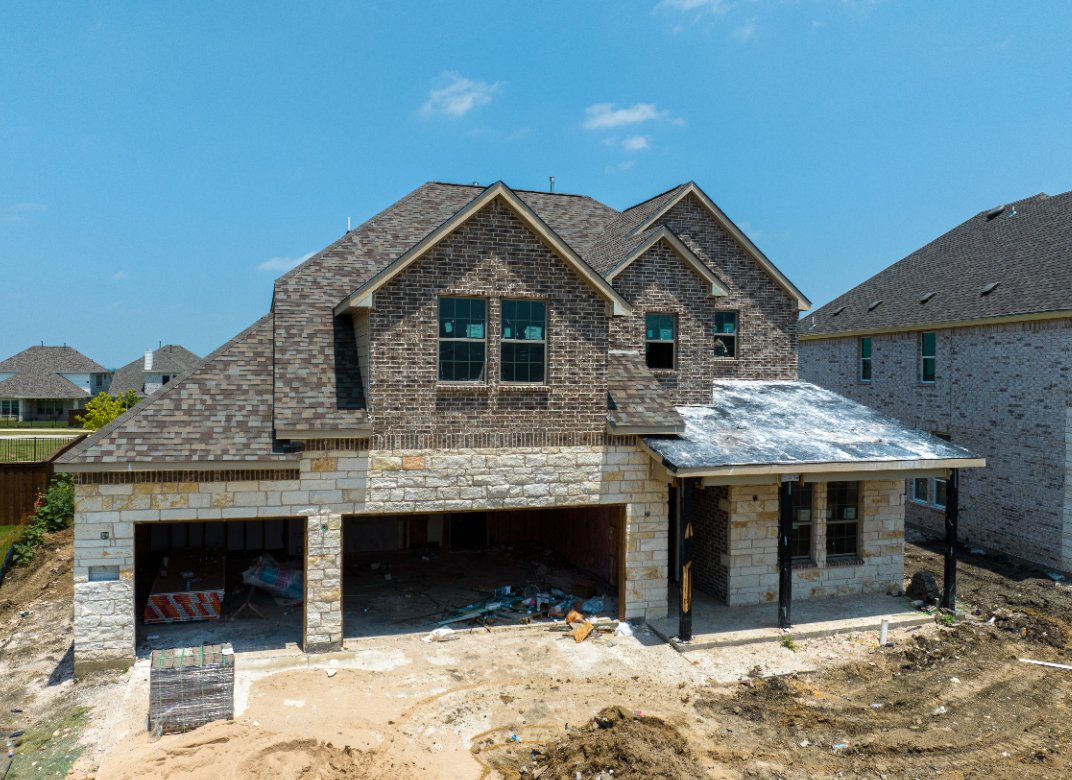
Not fully. The NTREIS figures count homes listed in the MLS, and many new homes in fast-selling areas never appear there. Rise Realty Texas agents report that builders in popular areas often sell homes before listing them, sometimes before construction starts. Occasionally a builder lists an unsold spec home in the MLS when it has not sold otherwise.
Where new construction is available also differs by county. Dallas County is an established county with little open land left for new neighborhoods, while the northern parts of Collin and Denton counties have had room for new communities. Agents at Rise Realty Texas also report that many Grayson County buyers are leaning toward new construction, where builders often promote incentives tied to their preferred lenders. Terms vary, so compare the Loan Estimate from a builder’s lender with one from at least one other lender before signing. Tried & True Home Loans is one option for that comparison.
Because the figures cover MLS-listed homes only, they describe the resale and listed-spec market. A buyer weighing new construction should also visit builder communities directly and read The New Construction Squeeze: Why Selling in Anna Is Different Than Selling in Plano and MUD vs. PID: What New Construction Buyers in Anna and Celina Need to Know Before Signing.
How do mortgage rates fit into this?
Mortgage rates are part of the backdrop, but this data does not show how much of the slowdown they explain. Freddie Mac’s weekly survey put the average rate on a conventional fixed-rate mortgage at 7.40 percent on October 8, 2026, up from 7.28 percent a week earlier and 6.30 percent a year earlier. Closed sales from July through September were 6.2 percent below a year earlier across the seven counties. Survey averages differ from what an individual borrower is offered, and a current quote from a licensed loan officer is the only reliable number for a specific purchase.
What should a buyer do differently in each type of county?
The right approach depends on how much supply a county has.
- Dallas, Collin and Denton counties (5.2 to 5.5 months of supply): Homes sold for 97.8 to 98.2 percent of list price, so expect to pay close to the listed price. Negotiating room sits more in terms than in price: repairs after the inspection, closing cost help and the option period. See How Much Can You Negotiate on a North Texas Home Right Now?
- Rockwall, Kaufman and Hunt counties (7 to 8 months): Supply is higher but signals are mixed, and Kaufman homes still sold for 99.0 percent of list price. Check recent sales on the specific street or subdivision instead of relying on a county average.
- Grayson County (9.5 months): Buyers have the most leverage. Ask how long the home has been listed, whether the price has been reduced and what the seller will contribute, and compare the answers with builder offers.
Before touring homes in any county, read Do You Need a Buyer Agreement to See Homes in Texas? to see how written buyer agreements work.
Who can help you buy a home in North Texas?
A Rise Realty Texas agent can compare the county, the city and the specific subdivision before you make an offer. Call (888) 774-7315 or visit riserealtytexas.com to speak with an agent or with Kelly Bishop, Texas Broker of Record. Browse North Texas communities or start with the buyer resources. For financing questions, call Tried & True Home Loans at 866-344-8845.
FOR REAL ESTATE AGENTS
What does a county-by-county market mean for your business as an agent?
When closings slow and counties diverge, an agent’s results depend on knowing which market they are working in and on how much of each commission the brokerage keeps. Closed sales from July through September were lower than a year earlier in all seven counties reviewed: down 5.3 percent across Collin, Denton and Grayson combined and down 6.2 percent across all seven. In Kaufman County they were down 20.7 percent.
Rise Realty Texas is a 100% commission, cloud-based brokerage for agents across North Texas. Agents keep their commission, pay no monthly or yearly brokerage fees on any program, and pay one all-inclusive transaction fee at closing, starting at $199. A slow month costs nothing in brokerage fees. Commissions are negotiable, and nothing here guarantees income. Programs are built around where an agent is in their career:
- Mentor: for newly licensed agents
- Rise 100: for any agent, with no sales quota
- Premier: for agents with 10 or more transactions in the past 12 months
- Broker Associates: for licensed brokers with 12 or more sales in the past 12 months
- Teams: for teams of three or more
To see how brokerage overhead interacts with a slower market, read The Balanced-Market Playbook: How Lower Brokerage Overhead Can Fund Your Own Lead Generation in North Texas. For the mechanics of moving, read How to Transfer Your Texas Real Estate License in TREC’s REALM Portal and Cloud-Based Real Estate Brokerage in North Texas: A Guide for Agents. To talk it through, call (888) 774-7315 or start at riserealtytexas.com/join.
Frequently asked questions
Is it a buyer's market in Collin County right now?
Not by the Texas A&M benchmark. Collin County had about 5.5 months of housing supply in September 2026, below the six to 6.5 months the Texas Real Estate Research Center describes as balanced, though up from 4.8 a year earlier. Homes took a median of 46 days to sell and sold for 97.8 percent of list price.
Which North Texas county has the most months of supply?
Of the seven counties reviewed, Grayson County had the most in September 2026, at about 9.5 months, up from 7.5 a year earlier. Hunt County followed at 8 months and Kaufman County at 7.5.
How long does it take to sell a home in Denton County?
In September 2026, the median home in Denton County took 46 days to sell, according to NTREIS. That compares with 44 days a year earlier and 26 days in September 2023.
How far below list price are homes selling in Grayson County?
Homes in Grayson County sold for 97.3 percent of list price in September 2026, down from 98.0 percent a year earlier and the lowest share of the seven counties reviewed. On a hypothetical $300,000 listing, that is about $291,900.
Do these numbers include new construction?
Only new homes listed in the MLS. Builders in fast-selling areas often sell homes before listing them, sometimes before construction begins, so those homes are not counted. Buyers interested in new construction should also look at builder communities directly and compare financing offers from more than one lender.
What is months of supply?
Months of supply is the number of months it would take to sell all active listings at the current sales pace. Rise Realty Texas calculates it by dividing active listings by that month's closed sales. The Texas Real Estate Research Center at Texas A&M describes six to 6.5 months as a balanced market.
Where does the data in this article come from?
- North Texas Real Estate Information Systems (NTREIS), county market statistics for residential sales (active listings, new listings, closed sales, median days to sell, close price to list price ratio and months of inventory), January 2023 through September 2026. Retrieved by Rise Realty Texas on October 7 and October 10, 2026.
- Freddie Mac, “Mortgage Rates Average 7.40%,” Primary Mortgage Market Survey release, October 8, 2026.
- Texas Real Estate Research Center, Texas A&M University, Texas Housing Insight, technical report, August 2022 data (balanced-market range of six to 6.5 months of inventory).
- Calculations by Rise Realty Texas: months of supply equals active listings divided by closed sales for the month, and year-over-year changes are computed from the NTREIS figures. Hypothetical examples are illustrations, not predictions.
This article is general information, current as of October 10, 2026, and is not legal, tax or lending advice. Market figures come from MLS data that can be revised and vary by county, city, neighborhood, price range and property type. Confirm contract terms with a licensed Texas real estate professional or attorney, and confirm loan options with a licensed loan officer. Rise Realty Texas LLC, TREC License #9016637. Rise Realty Texas refers mortgage business to Tried & True Home Loans, a licensed mortgage broker (NMLS ID 2034819), and does not originate loans. Verify mortgage licenses at www.nmlsconsumeraccess.org. Equal Housing Opportunity. Equal Housing Lender.
Categories
Recent Posts